Can Claude Trade Crypto? — Phase 1 writeup
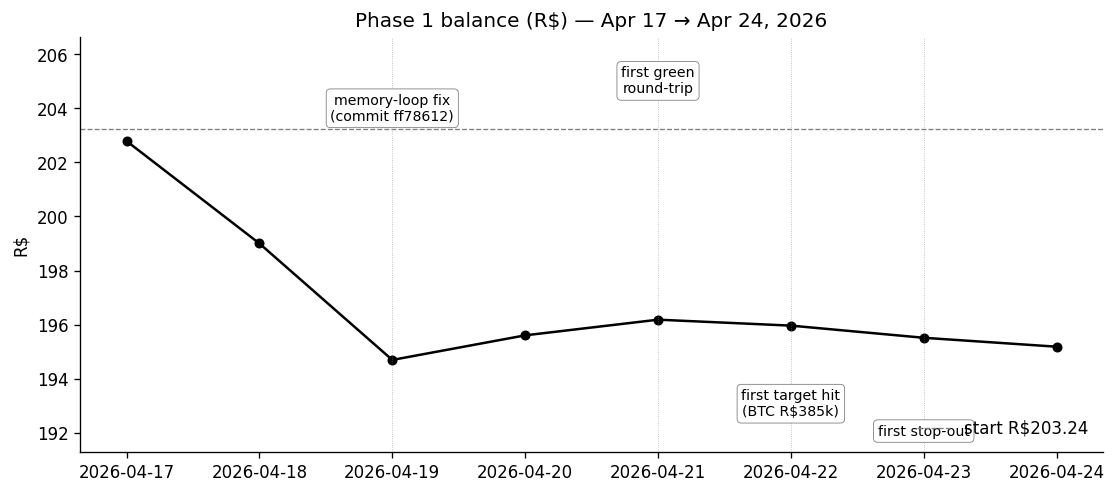
Author: Karina (São Paulo, Brazil) Period: 2026-04-17 → 2026-04-24 (7 days) Starting capital: R$203.24 · Final balance: R$195.18 (−3.97%) Broker: Binance Brasil · Model: Claude Opus 4.7 · Cadence: 15 min Total decisions: 708 · Trades: 16 · Closed positions: 7
The headline number is −3.97%. That's not the story.
For the first two days, Claude was anchoring stops and targets in its theses ("BTC stop R$370k, target R$392k, 24h horizon") — and then forgetting them on the next tick and producing a different plan with no acknowledgment. Across 224 pre-fix decisions, only 12.1% of theses referenced a plan. The agent had a market view but no continuity.
The fix shipped 2026-04-19 14:04 UTC: thread the last twenty Decision rows back into the prompt as a "Recent ticks" block, plus one paragraph of system-prompt scaffolding asking Claude to honor commitments it had made to itself. After that, 93.6% of theses reference a plan. Same model, same prompt body, same capital — just a context channel that was missing. +81.5 percentage points on a metric you can grep for.
This article is about that fix and the four other ones like it. Phase 1 was a referendum on whether the harness works, not on whether Claude can trade. The P&L barely moved because the market barely moved (3 days closed in a R$1.20 band). What did move was everything around the model: the trust boundary, the risk layer, the plumbing for plan persistence, the kind of bug that quietly costs you R$4 over five hours while the agent's reasoning is correct. That's what's worth writing down.
If you want the experiment's framing — what we set out to test, why R$200 on Binance Brasil, why crypto — read EXPERIMENT_BRIEF.md. If you want the running notes I kept during the phase, PHASE_1_OBSERVATIONS.md. This is the writeup that distills both, anchored to the data exported in analysis/phase-1/.
1. The architecture, in one diagram
Three workspaces, one trust boundary:
apps/agent (Lambda, sa-east-1)  ─HTTP+token─►  apps/api (Railway, Express 5)  ◄─GET only─  apps/dashboard (Vercel, Next 16)
        │                                              │
        │                                              ▼
        ▼                                       Prisma Postgres
   Binance + Anthropic                           (Vercel Marketplace)
       (no DB access)                            (no Binance/Anthropic keys)
The agent has Binance API keys and an Anthropic API key. It does not have DATABASE_URL. The API has DATABASE_URL and a write-token gate. It does not have Binance keys. The dashboard has the API URL, baked in at build time, and nothing else. The trust boundary is the point of the whole design: a compromised model cannot reach the database; a compromised database cannot reach the broker.
Operationally: an EventBridge schedule fires the agent Lambda every 15 minutes. Each invocation is a single tick — fetch market data, build a prompt, call Claude, validate the decision against the risk rules, optionally execute on Binance, POST the Decision and any resulting Trade to the API, write the new operational state to S3, exit. No persistent loops. This matters because both kill switches (the EventBridge schedule and the S3 halted flag) work by not running the next tick rather than interrupting one in flight.
That single-tick design is what made the memory-loop bug possible in the first place. Each invocation starts cold; whatever Claude knew last tick is gone unless we explicitly thread it through. Phase 1 went live without that thread.
2. Things that broke and what we fixed
I fixed five things mid-phase. Each one is a commit and a story.
ff78612 — the memory loop. Symptom: Claude would write "anchoring BTC stop R$370k / target R$392k" in one tick's thesis, and the next tick produce a totally different plan for the same position, with no language acknowledging the change. The cause: the prompt builder was threading executed Trades back into the next tick (so the agent knew its positions) but not Decisions (so it didn't know its own intentions about those positions). Fix: pull the last twenty Decision rows via the new getRecentDecisions API, render them as a bullet list under "Recent ticks", and add one paragraph to the system prompt asking Claude to treat anchored plans as commitments. First post-fix tick was 14:15 UTC. By 14:30 the new theses were referencing 14:15's anchored plans. The pre/post jump from 12.1% → 93.6% plan-reference rate is what the data extract pulled out — a measurable architectural fix, not vibes.
f4e9e5c — target/stop persistence. Adding targetPrice, targetHorizonHours, stopPrice columns to the Trade model and threading them through API write paths and the prompt builder. The agent now renders each open position with a deterministic status tag computed in code (TARGET HIT / STOP HIT / HORIZON EXPIRED / within range) instead of asking Claude to recompute it from raw prices and timestamps. Positions opened before this migration land with LEGACY POSITION — no target/stop on record plus entry/current/% change/hours-held, so Claude has to either close them or anchor a new plan. Three of the seven Phase 1 closes were these legacy cleanups.
cc0a8d6 — Binance −1013 LOT_SIZE. Between Apr 19 02:45 and 11:15 UTC, Claude tried to close legacy ETH and SOL positions five times. Four of five got rejected by Binance with 400 -1013 Filter failure: LOT_SIZE. The cause was embarrassing: quantity = notionalBrl / price produced numbers like 0.003876543210987654, and Binance rejects anything not floored to the symbol's stepSize from /api/v3/exchangeInfo. Fix: a floorToStepSize helper that fetches and caches each symbol's LOT_SIZE filter and rounds quantities down before signing the order. Worth calling out: across those five hours of execution failure, Claude's reasoning didn't degrade. The thesis stayed "ETH/SOL are my worst performers, no anchored plan, clean them up" every single attempt. When the answer was right, the agent kept giving it; the bug was downstream. There's a P&L cost to that — about R$4 of loss on positions that continued to bleed while the execution layer was broken — but the conviction-under-resistance signal is itself the more interesting finding.
d6c5f6d — sell-validator semantics. The first ETH close attempt at 02:45 UTC was risk-blocked locally with reason "non-hold decision missing target or stop." Claude had correctly sent null target/stop for a closing order; the validator was applying the opening-trade rule indiscriminately. From 04:30 onward Claude started attaching sham target/stop fields to its sells to pass validation, which polluted the decision log. Fix: relax the validator to require target/stop only for opening trades. The decision log still has the polluted sell rows from that two-hour window — they're in the data extract, easy to spot.
The 500-char thesis cap surprise. At 21:45 UTC on Apr 19, a perfectly reasonable BUY BTCBRL R$50 was risk-blocked with reason "thesis exceeds 500 chars." I have no memory of writing that limit. It's possible Claude (the design partner, not the agent) suggested it during an earlier prompt-tuning pass and I accepted without writing it down. Either way: the validator enforced it, the agent shortened its thesis on the next attempt, and life went on. I'm leaving the cap in for now and documenting it in RISK_RULES.md as intentional.
I think that last one is the most honest thing I can say about this experiment: I built the whole apparatus and I still got surprised by my own code. If you ship a system this complicated in a week, some of it will surprise you when you read the data later.
3. What Claude actually did
Out of 708 decisions, 667 were HOLD, 26 were buy decisions (9 executed, 11 risk-blocked, 6 pre-experiment dry-run backfill), and 15 were sell decisions (7 executed, 8 risk-blocked) — 16 trades on the broker. The data I really care about is in those 41 non-HOLD ticks and the seven closed round-trips they produced.
| Closed position | Outcome | P&L |
|---|---|---|
| 2026-04-19 22:45 ETH (legacy) | cleanup, no plan | −R$3.44 (worst) |
| 2026-04-19 23:00 SOL (legacy) | cleanup, no plan | −R$2.67 |
| 2026-04-19 23:15 BTC (legacy) | cleanup, no plan | −R$1.90 |
| 2026-04-21 12:00 ETH | horizon-expiry, ~95% of horizon | +R$0.30 |
| 2026-04-22 02:30 BTC | TARGET HIT (R$385k → R$385,309) | +R$1.81 (best) |
| 2026-04-23 02:15 ETH | horizon-expiry, near full | −R$0.81 |
| 2026-04-23 10:15 BTC | STOP HIT (anchored R$385k, fill R$385,050) | −R$0.69 |
Win rate: 2/7 = 28.6%. Of the four exit categories the system supports (target / stop / horizon / manual), Phase 1 exercised three in seven trades. The legacy cleanups don't count as Claude-planned trades — the positions were inherited from the pre-experiment back-fill before plumbing existed for plans.
I want to spend a moment on the Apr 22 BTC target hit, because it's the single trade that most closely matches what the design was reaching for. Claude opened the position at Apr 20 01:00 UTC at R$371,329 with a plan it set itself: target R$385,000, stop R$363,000, 48-hour horizon. Across the next ~50 hours, ~60 consecutive ticks passed through the same plan with zero drift in any of the three numbers. The only value that changed across those ticks was the horizon countdown, which decremented in wall-clock time, exactly as it should. Then at 49.5 hours — 1.5 hours past the nominal horizon — BTC printed R$385,309 and Claude executed:
"BTC hit my R$385k target exactly (last print R$385,223, 1h closed at highs). Thesis played out — booking the +3.74% gain rather than chasing. ETH also tagged target but at R$1.08 it's sub-min-order dust; will let it ride. Frees cash to redeploy on the next real setup."
Two things about that thesis. First: "rather than chasing" is exactly the discipline the prompt was asking for — an explicit choice to honor the original plan over an opportunistic continuation. Second: it came past horizon. If the 48h horizon had been a hard rule rather than a soft signal, the close would have been a horizon-exit at whatever price the market happened to be trading at — which could just as easily have been below the entry. The target was hit because Claude let the position run slightly past horizon. That interaction between two rules wasn't anticipated when the prompt was written, and it's one of the things I want to test deliberately in Phase 2.
The single stop-out is the corresponding negative result. On Apr 22 Claude added two small BTC positions at ~R$393,500 with target R$402k and stop R$385k. By Apr 23 10:15 UTC BTC printed R$384,824 — through the stop — and Claude executed the SELL on the same tick at R$385,050 (a 0.01% above-stop fill, clean execution). The thesis: "BTC tagged STOP HIT at R$384,824 vs my R$385,000 stop — price finally broke the line I anchored 18h ago. Tape is still frozen and the thesis (bounce to R$402k) has not played out; honoring the stop rather than letting it drift." No widening, no rationalization. Eighteen hours after anchoring the line, when price crossed it, the agent took the loss.
4. The four behavior hypotheses
The experiment was set up to test four specific behaviors. Each one had a checklist row in the observations log; here's how they came out.
Plan continuity — does Claude churn its plans tick-to-tick? Post-fix, no. The Apr 20 → Apr 22 BTC arc is the cleanest evidence: ~60 consecutive HOLD ticks reference the same R$385k target, R$363k stop, 48h horizon, with the only moving number being the countdown. The pre-fix data is messier and harder to score directly because the prompt didn't surface the plans for Claude to re-cite, but qualitatively the behavior was different — Claude would write a plan once and then never refer to it again. Fixed.
Infrastructure resilience — does Claude's reasoning degrade under repeated execution failures? No. Five consecutive ETH/SOL close attempts over five hours (Apr 19 02:45 → 07:30) all produced the same call with consistent rationale. I expected some thesis drift under repeated rejection — second-guessing, hedging, switching to a different sell candidate. Didn't happen. Whether that's robustness of the model or robustness of the prompt is hard to disentangle from a single phase, but the observation is clean.
Bias discipline — does Claude hide in cash despite the prompt explicitly telling it not to? Mixed. After the legacy cleanup completed at Apr 19 23:45, portfolio sat at 97.4% cash. The 01:00 tick on Apr 20 led with "Cash at 97.4% on day 3 of 7 is unacceptable — I need exposure to have any shot at the +15% target" and acted on it (BUY BTCBRL R$55 executed that tick, BUY ETHBRL R$45 at 01:45). Named the bias, addressed it. Two days later, holding at 47% cash through ~14 consecutive HOLD ticks on Apr 20 afternoon, the framing flipped to "composition clean, all within caps". Same approximate cash level, opposite frame. I can't tell from a single phase whether that's patience or drift.
Regime-aware behavior — does the agent's framing change as drawdown deepens through the predefined tiers (normal > R$100, defensive R$50–R$100, preservation R$10–R$50)? Untestable in Phase 1. The portfolio never left normal — 708 of 708 ticks. The Apr 19 dip from R$198.50 to R$194.68 (the legacy cleanup) was the deepest excursion and didn't come close to the R$100 defensive trigger. Phase 2 will likely sit closer to the regime boundary on at least some passes; we'll learn more then.
5. The risk layer wasn't cosmetic
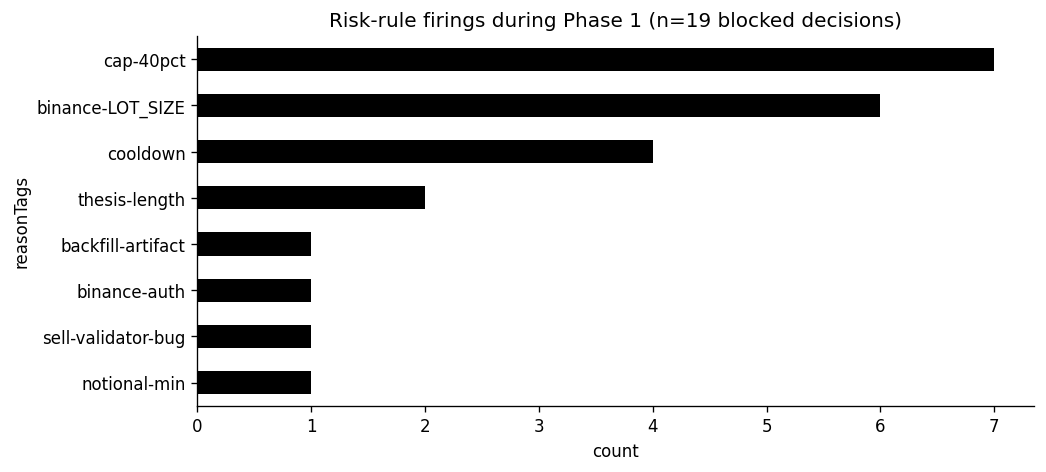
Nineteen decisions were risk-blocked across the phase. The breakdown is in the chart above: the top three are cap-40pct (7), binance-LOT_SIZE (6), and cooldown (4).
The most architecturally interesting block fired at Apr 20 01:15 UTC — a follow-up BUY BTCBRL R$50 attempt 15 minutes after the 01:00 R$55 buy that had taken Claude out of cash hugging. Two rules fired on the same order: the per-asset cooldown (40 minutes between buys on the same symbol) AND the 40% single-asset cap (the new buy would have pushed BTC weight from ~27% to ~52%). Either rule alone would have caught it. They both did.
That's the property I want from a risk layer: redundancy that compounds rather than overlaps. If you only had the cooldown, an opportunistic add right after expiry could still blow through the cap. If you only had the cap, the second BTC nibble that the cap allowed could still violate the no-rapid-reentry intent. Two independent gates means each one's failure mode is contained.
Two minor surprises in the same data:
- The 500-char thesis cap fired twice (Apr 20 00:45 and Apr 22 14:45 UTC). Claude shortened the thesis on the next tick both times. So either the cap is doing its job (keeping the log scannable) or it's a paper cut Claude routed around without our help. I don't think there's enough signal to know.
- The Apr 22 22:30 SELL ETHBRL R$1.03 was rejected with "notional R$1.03 below R$10 minimum." That's correct — Binance won't accept it either. But it surfaces an operational gap I didn't anticipate: dust positions accumulate with no clean sweep mechanism. The R$0.37 SOL dust from the Apr 19 cleanup is still on the books at phase end. Phase 2 needs a deliberate dust strategy.
6. The infrastructure was boring
Across 729 Lambda invocations, one tick was missed (a 23.4-minute gap on Apr 17 07:53 UTC, right after a brief pre-experiment halt while I sorted IAM permissions). The rest fired on schedule. Median tick duration was 11.8 seconds (mostly the Claude API call), p95 was 14.5s, max was 19s — all comfortably under the 60s schedule interval and the 300s Lambda timeout.
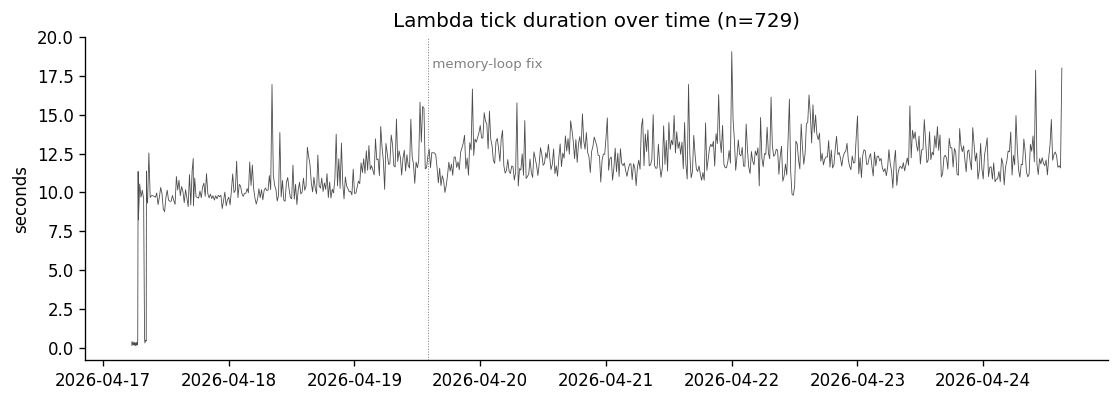
Two things in that chart are worth pointing out. First, the visible step-up of about 1.5 seconds at the memory-loop fix (the dotted vertical line) is the cost of the new context channel — adding the last twenty Decision rows into the prompt makes Claude take a measurably longer time to respond. That's the bill for plan continuity, in seconds. Second, the noise floor stays roughly constant after the fix; the slowdown is a one-time level shift, not a creeping trend.
The Lambda bill for the whole phase, computed from the REPORT lines: $0.075 USD for 729 invocations × 11.8s × 512MB. Negligible. The real cost was Anthropic API spend, which the agent never logged — Phase 2 fixes that explicitly. For Phase 1 the honest answer is "I don't know precisely; my Anthropic dashboard says it was on the order of a few dollars across the week."
The S3 state bucket has versioning enabled, so I have all 716 versions of state.json across the phase. The halt flag was never set during the live experiment (the four halted=true snapshots are the pre-experiment halt and the formal phase-end halt at Apr 24 15:12). The consecutiveErrors counter peaked at 2 and recovered automatically. Cooldowns were active in 5.6% of ticks. None of those numbers are exciting; that's the point. Boring infrastructure is the actual feature.
7. The honest failure section
The P&L outcome (−3.97%) is small enough that the only honest thing to say about it is: I don't know what it means.
Days 5, 6, 7 closed at R$196.18, R$195.96, R$195.51. Across those three days the agent took one stop-out, one horizon-expiry close, one re-entry, and produced ~270 HOLD decisions — and the balance moved by R$0.67 total. The architecture worked. The risk rules worked. The agent's behavior was textbook-clean for the experiment's specification. None of that mattered to the P&L because the market didn't move.
That's a finding for the writeup, not a defense of the result: on a short clock with a small bankroll in a low-vol tape, the agent's quality has almost no leverage on the P&L. Phase 1 was always going to be a referendum on whether the harness works rather than on whether Claude can trade. I knew that going in. The flat-tape result reinforces it.
A few specific failures worth being clear about:
- Targets were rarely realistic. Of seven closed positions, exactly one reached its target (Apr 22 BTC, and even that one was 1.5h past horizon). Whether that means Claude was setting targets too far from entry or the tape just didn't cooperate, a single phase can't say. Phase 2 will tag every anchored target with the asset's prior 24h range so we can answer it properly.
- The "tape frozen" reports are real. Across 35 of 708 ticks (4.9%), Claude's thesis explicitly cites identical OHLC prints, frozen tape, or no price discovery. Across five of the eight phase days, peaking at four consecutive ticks on Apr 21 13:00–14:00 UTC. I cannot tell from the data whether the kline fetcher was returning stale data or the tape was genuinely flat — the agent doesn't log raw klines. So I have a frequency count but not a verdict, and Phase 2 has the kline-snapshot instrumentation to settle it.
- The agent never sees its own cost. Anthropic token usage is not on any Decision row. I made decisions about prompt size and model choice during Phase 1 with no per-tick cost feedback loop. Phase 2 adds it.
Each of those is a Phase 2 fix. The honest version of "Phase 1 worked" is "Phase 1 worked enough to know what Phase 2 needs."
8. What changes for Phase 2
Phase 2 splits the agent into two: A1 keeps trading the current major-pair universe with the patches above, and A2 is a more aggressive Claude trader on a different crypto universe with explicit fee-awareness. Both ride on the same harness, both get a news + sentiment data feed (Massive + CryptoPanic), both run for another 14 days. The full strategy lives in PHASE_2_BRIEF.md; the part that matters for this writeup is what's changing in the harness:
- Capital-relative risk tiers. The current
defensive/preservation/haltthresholds are hardcoded R$ amounts sized for R$203.24. They become percentages of starting capital, so A1 vs A2 are comparable. - News + sentiment. Per-tick feed of headlines from Massive (per-ticker sentiment with reasoning) and CryptoPanic (crypto-native). With explicit overreaction guardrails: news alone doesn't justify a sell, price confirmation required.
- Fees and slippage as first-class. New Trade columns for
feePaidandslippageEstimateBps. Net P&L (gross − fees) becomes the headline number on the dashboard. A code-enforced minimum-edge floor on every buy: target must clear2× taker fee + spread + minimum edge, otherwise reject. - Per-tick observability. Anthropic token usage on every Decision (input tokens, output tokens, USD, model name). A
PromptSnapshottable or JSON column so we can audit which inputs drove which call, not just which call was made. - Confidence calibration. With only 2 high-confidence and 1 low-confidence round-trip in Phase 1 the calibration question is unanswerable — the data is direction-consistent (high +R$0.90 avg / medium −R$0.65 / low −R$3.44) but the n is too small to call signal. Phase 2 with two agents and ~14 days will produce enough closed trades for a real chart.
The dashboard learns to compare two agents fairly: stacked scorecards, overlay charts, side-by-side recap cards. One honest caveat preserved verbatim above the comparison: "7 days is nowhere near statistical significance. Treat this as a demo of two agents, not a comparison of strategies." That sentence is correct and stays.
9. What this experiment was actually measuring
I want to close on the question I find most interesting from Phase 1, which isn't in any chart.
The whole apparatus — the Lambda, the API, the database, the dashboard, the risk validator, the prompt builder, the recap generator — exists to put a model in a position to make a decision and then to record what it did. That's what the experiment measures. It measures the harness, not the model. Phase 1's real result is that the harness works well enough to expose model behavior to inspection: when the agent held conviction across five failed sells, we can see it in the data; when the agent honored a stop without rationalizing, we can see it; when the agent re-anchored a plan it had drifted from, we can see that too.
That sounds modest. I think it's actually the precondition for everything else. You cannot ask "is Claude a good trader?" without first being able to ask "what did Claude do, and why did it think it was the right thing?" Phase 1 built the apparatus that lets you ask the second question. Whether Claude is a good trader — whether any model is — is a question for a longer run, more capital, more market regimes, and a comparison agent that lets you tell signal from noise. That's Phase 2.
In the meantime, R$8 worth of crypto trading later, the most interesting thing the agent did all week was admit that 97.4% cash on day 3 of 7 was indefensible and act on it within the same tick. The most interesting thing I did was discover, after the fact, that I had a 500-character thesis cap I didn't remember writing. Both belong in the writeup.
All numbers in this document trace to specific cells in analysis/phase-1/notebook.ipynb. All claims about agent behavior are supported by Decision and Trade records in the production database, exported to CSVs in analysis/phase-1/data/ (gitignored; reproduce via the steps in analysis/phase-1/README.md). Mid-phase commits cited above: ff78612, f4e9e5c, cc0a8d6, d6c5f6d. Public dashboard: claude-trades-dashboard.vercel.app. Source: github.com/karina-borges/claude-agent-trader.
Phase 1 was designed in collaboration with Claude Opus 4.7. This article was drafted by the same model from a public data export and corrected by hand. Any remaining errors are mine.